181:
197:
100:. The observed pattern of bacterial growth is bi-phasic because two different sugars were present, glucose and lactose. The bacteria prefer to consume glucose (Phase I) and only use the lactose (Phase II) after the glucose has been depleted. Analysis of the molecular basis for this bi-phasic growth curve led to the discovery of the basic mechanisms that control
20:
151:
In the example shown in Figure 2, a tumor is found after the cell growth rate has slowed. Most of the cancer cells are removed by surgery. The remaining cancer cells begin to proliferate rapidly and cancer chemotherapy is started. Many tumor cells are killed by the chemotherapy, but eventually some
139:
and can cause the death of cells that attempt to replicate their DNA and divide. A rapidly growing tumor will have more actively dividing cells and more cell death upon exposure to such anticancer drugs.
144:
123:
is related to the rate of tumor growth before treatment. Tumors that grow rapidly are generally more sensitive to the toxic effects that conventional
330:
152:
cancer cells that are resistant to the chemotherapy drug begin to grow rapidly. The chemotherapy is no longer useful and is discontinued.
115:
research is an area of biology where growth curve analysis plays an important role. In many types of cancer, the rate at which
284:
310:
216:. Typically, periods of exponential growth are of limited duration due to depletion of some rate-limiting resource.
180:
196:
364:
171:
250:
374:
311:
Kahm, M. and
Hasenbrink, G. and Lichtenberg-Fraté, H. and Ludwig, J. and Kschischo, M. (2010).
68:
270:
369:
63:, for growth analysis of individuals). Values for the measured property can be plotted on a
8:
359:
64:
324:
213:
52:
230:
225:
124:
93:
present in a nutrient-containing broth was measured during the course of an 8-hour
80:
24:
136:
101:
36:
240:
132:
128:
353:
244:
166:
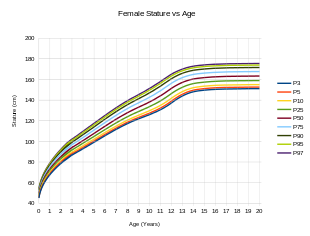
Children who fall significantly below the normal range of growth curves for
187:
167:
161:
120:
39:
of the evolution of a quantity over time. Growth curves are widely used in
94:
59:, for population growth analysis), individual body height or biomass (in
19:
97:
86:
60:
56:
44:
212:
Some growth curves for certain biological systems display periods of
90:
16:
Empirical model of the evolution of a population or biomass over time
344:
312:
234:
48:
40:
143:
112:
116:
285:"Population Limiting Factors | Learn Science at Scitable"
131:. Many conventional anticancer drugs (for example,
313:"grofit: Fitting Biological Growth Curves with R"
351:
174:and might be treatable with hormone injections.
268:
329:: CS1 maint: multiple names: authors list (
319:. Vol. 33, no. 7. pp. 1–21.
155:
142:
71:of time; see Figure 1 for an example...
18:
352:
271:"Growth hormone deficiency - children"
207:
107:
74:
13:
14:
386:
338:
195:
179:
317:Journal of Statistical Software
304:
85:In this example (Figure 1, see
277:
262:
1:
345:CDC recommended growth charts
147:Figure 2. Tumor growth curve.
202:Male Stature vs Age (US CDC)
7:
219:
89:for details) the number of
10:
391:
159:
78:
172:growth hormone deficiency
256:
251:Von Bertalanffy function
43:for quantities such as
156:The growth of children
148:
28:
23:Figure 1: A bi-phasic
160:Further information:
146:
22:
269:Kaneshiro, Neil K.
127:have on the cancer
365:Population ecology
214:exponential growth
208:Exponential growth
170:can be tested for
149:
108:Cancer cell growth
53:population ecology
29:
231:Exponential curve
226:Gompertz function
135:) interfere with
119:shrink following
382:
334:
328:
320:
299:
298:
296:
295:
281:
275:
274:
266:
199:
183:
125:anticancer drugs
81:Bacterial growth
75:Bacterial growth
25:bacterial growth
390:
389:
385:
384:
383:
381:
380:
379:
350:
349:
341:
322:
321:
307:
302:
293:
291:
283:
282:
278:
267:
263:
259:
222:
210:
203:
200:
191:
190:vs Age (US CDC)
184:
164:
158:
137:DNA replication
110:
102:gene expression
83:
77:
37:empirical model
17:
12:
11:
5:
388:
378:
377:
372:
367:
362:
348:
347:
340:
339:External links
337:
336:
335:
306:
303:
301:
300:
289:www.nature.com
276:
273:. MedlinePlus.
260:
258:
255:
254:
253:
248:
241:Logistic curve
238:
228:
221:
218:
209:
206:
205:
204:
201:
194:
192:
185:
178:
157:
154:
133:5-Fluorouracil
109:
106:
79:Main article:
76:
73:
15:
9:
6:
4:
3:
2:
387:
376:
375:Growth curves
373:
371:
368:
366:
363:
361:
358:
357:
355:
346:
343:
342:
332:
326:
318:
314:
309:
308:
290:
286:
280:
272:
265:
261:
252:
249:
246:
245:sigmoid curve
242:
239:
236:
232:
229:
227:
224:
223:
217:
215:
198:
193:
189:
182:
177:
176:
175:
173:
169:
163:
153:
145:
141:
138:
134:
130:
126:
122:
118:
114:
105:
103:
99:
96:
92:
88:
82:
72:
70:
66:
62:
58:
54:
50:
46:
42:
38:
34:
26:
21:
370:Bacteriology
316:
305:Bibliography
292:. Retrieved
288:
279:
264:
211:
165:
162:Human height
150:
121:chemotherapy
111:
84:
33:growth curve
32:
30:
168:body height
95:cell growth
360:Population
354:Categories
294:2018-09-20
247:, S-curve)
98:experiment
87:Lac operon
61:physiology
57:demography
45:population
325:cite news
220:See also
91:bacteria
69:function
47:size or
235:J-curve
188:Stature
186:Female
49:biomass
41:biology
117:tumors
113:Cancer
35:is an
27:curve.
257:Notes
129:cells
67:as a
65:graph
331:link
55:and
51:(in
356::
327:}}
323:{{
315:.
287:.
104:.
31:A
333:)
297:.
243:(
237:)
233:(
Text is available under the Creative Commons Attribution-ShareAlike License. Additional terms may apply.

