229:
249:
33:
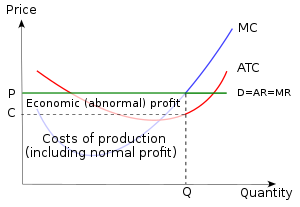
264:, meaning that firms can enter (and exit) the market at will with no logistical, legal, or other inhibiting factors, and if firms have U-shaped long-run average cost curves as in the graphs at the right, then in the long run all firms will end up producing at their point of minimum average cost. For suppose a particular firm with the illustrated long-run average cost curve is faced with the market price
138:
206:
The "diseconomies of scale" do not tend to vary widely by industry, but "economies of scale" do. An auto maker has very high fixed costs, which are lower per unit of output the more output is produced. On the other hand, a florist has very low fixed costs and hence very limited sources of economies
280:
in the graph's notation. With firms making economic profit and with free entry, other firms will enter the market for this product, and their additional supply will bring down the market price of the product; this process will continue until there is no longer any economic profit to entice further
296:
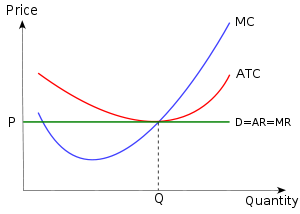
Thus with firms possessing U-shaped long-run average cost curves, perfect competition, with (1) firms small enough relative to the overall market that they cannot individually influence the product's market price, and with (2) free entry, leads in the long run to a situation in which no firm is
215:
An industrial society will tend to have large firms, as industry has substantial economies of scale. A service-based economy will favor smaller firms, as services have limited economies of scale. There will, of course, be exceptions, such as
197:
industry standards (like
Microsoft Windows), etc. If only these "economies of scale" applied, then the ideal firm size would be infinitely large. However, since both apply, the firm must not be too small or too large, to minimize unit costs.
285:, with marginal cost equalling price at the minimum of the long-run average cost curve, and with the gap between average revenue (the height of the average revenue curve at this
272:
in the upper graph), and its per-unit economic profit is the difference between average revenue AR and average total cost ATC at that point, the difference being
297:
making economic profit, and in which firms are of their socially optimal size (producing at the minimum of their long-run average cost curve).
185:
existed, then the long-run average cost-minimizing firm size would be one worker, producing the minimal possible level of output. However,
105:
54:
77:
193:
discounts (components, insurance, real estate, advertising, etc.) and can also limit competition by buying out competitors, setting
84:
268:
indicated in the upper graph. The firm produces at the quantity of output where marginal cost equals marginal revenue (labeled
252:
After entry of enough other firms has occurred, their increase in market supply has driven down the price of the good, so that
91:
281:
entrants. The long-run outcome is shown in the second graph, with production by each firm occurring at the newly labelled
73:
124:
62:
17:
58:
348:
210:
207:
of scale. Thus there are disparate degrees of economies of scales for different types of organizations.
98:
343:
328:
173:
in a given industry at a given time which results in the lowest production costs per unit of output.
43:
316:
47:
306:
182:
142:
8:
189:
also apply, which state that large firms can have lower per-unit costs due to buying at
157:, reflecting diseconomies of scale. Consequently, the societally optimal firm size is OQ
311:
236:. This situation is shown in this diagram, as the price or average revenue, denoted by
228:
186:
329:
Bureaucratic limits of firm size: Empirical analysis using transaction cost economics
211:
Effects of agricultural, industrial, and service-based economies on optimal firm size
253:
233:
248:
337:
145:
diagram shows that as more is produced, so long as output does not exceed OQ
154:
261:
217:
190:
240:, is above the minimum average cost. The firm produces the quantity
32:
232:
In the short run, it is possible for an individual firm to make an
194:
170:
137:
289:) and average cost (the height of the average cost curve at this
201:
244:, at the intersection of marginal cost and marginal revenue.
161:, where long-run average cost is at its lowest level.
223:
335:
149:, economies of scale are obtained. Beyond OQ
61:. Unsourced material may be challenged and
202:Variation in optimal firm size by industry
125:Learn how and when to remove this message
247:
227:
136:
14:
336:
220:, which is a huge services company.
153:, additional production will increase
260:If the market for a product exhibits
59:adding citations to reliable sources
26:
24:
25:
360:
224:Effect of free entry on firm size
31:
13:
1:
322:
176:
74:"Socially optimal firm size"
7:
300:
10:
365:
167:socially optimal firm size
317:Minimum efficient scale
257:
256:of each firm are zero.
245:
162:
307:Diseconomies of scale
251:
231:
183:diseconomies of scale
143:long-run average cost
140:
349:Production economics
55:improve this article
312:Economies of scale
258:
246:
187:economies of scale
169:is the size for a
163:
135:
134:
127:
109:
16:(Redirected from
356:
344:Market structure
254:economic profits
130:
123:
119:
116:
110:
108:
67:
35:
27:
21:
364:
363:
359:
358:
357:
355:
354:
353:
334:
333:
325:
303:
234:economic profit
226:
213:
204:
179:
160:
152:
148:
131:
120:
114:
111:
68:
66:
52:
36:
23:
22:
18:Ideal firm size
15:
12:
11:
5:
362:
352:
351:
346:
332:
331:
324:
321:
320:
319:
314:
309:
302:
299:
293:) being zero.
225:
222:
212:
209:
203:
200:
178:
175:
158:
155:per-unit costs
150:
146:
133:
132:
39:
37:
30:
9:
6:
4:
3:
2:
361:
350:
347:
345:
342:
341:
339:
330:
327:
326:
318:
315:
313:
310:
308:
305:
304:
298:
294:
292:
288:
284:
279:
275:
271:
267:
263:
255:
250:
243:
239:
235:
230:
221:
219:
208:
199:
196:
192:
188:
184:
174:
172:
168:
156:
144:
139:
129:
126:
118:
107:
104:
100:
97:
93:
90:
86:
83:
79:
76: –
75:
71:
70:Find sources:
64:
60:
56:
50:
49:
45:
40:This article
38:
34:
29:
28:
19:
295:
290:
286:
282:
277:
273:
269:
265:
259:
241:
237:
214:
205:
180:
166:
164:
121:
112:
102:
95:
88:
81:
69:
53:Please help
41:
195:proprietary
115:August 2013
338:Categories
323:References
262:free entry
177:Discussion
85:newspapers
218:Microsoft
42:does not
301:See also
181:If only
171:company
99:scholar
63:removed
48:sources
276:minus
101:
94:
87:
80:
72:
141:This
106:JSTOR
92:books
191:bulk
165:The
78:news
46:any
44:cite
57:by
340::
291:Q
287:Q
283:Q
278:C
274:P
270:Q
266:P
242:Q
238:P
159:2
151:2
147:2
128:)
122:(
117:)
113:(
103:·
96:·
89:·
82:·
65:.
51:.
20:)
Text is available under the Creative Commons Attribution-ShareAlike License. Additional terms may apply.


